Samuel Heister
SharpEye Capital, and the systems I built getting there.
I build market and data systems. SharpEye is the big one; five smaller ones sit alongside it, and three of those are open below on live data — running in your browser rather than screenshotted.
- Drawn by
- Samuel Heister
- Location
- Cambridge, Maryland
- Currently
- Benefits consultant, Aflac
- Contents
- 5 sheets · 3 live
- Prices as of
- 2026-10-23
SharpEye Capital
the main build
A market-intelligence platform and an automated operation trading prediction-market binaries, across the companies building AI infrastructure.
The firm's own figures are not published here. Signals, thresholds, formulas and sizing stay abstracted by design; what follows is architecture, and the parts anyone can check. Its language work runs on Anthropic's API — the firm does not train or serve a model of its own.
How it is put together
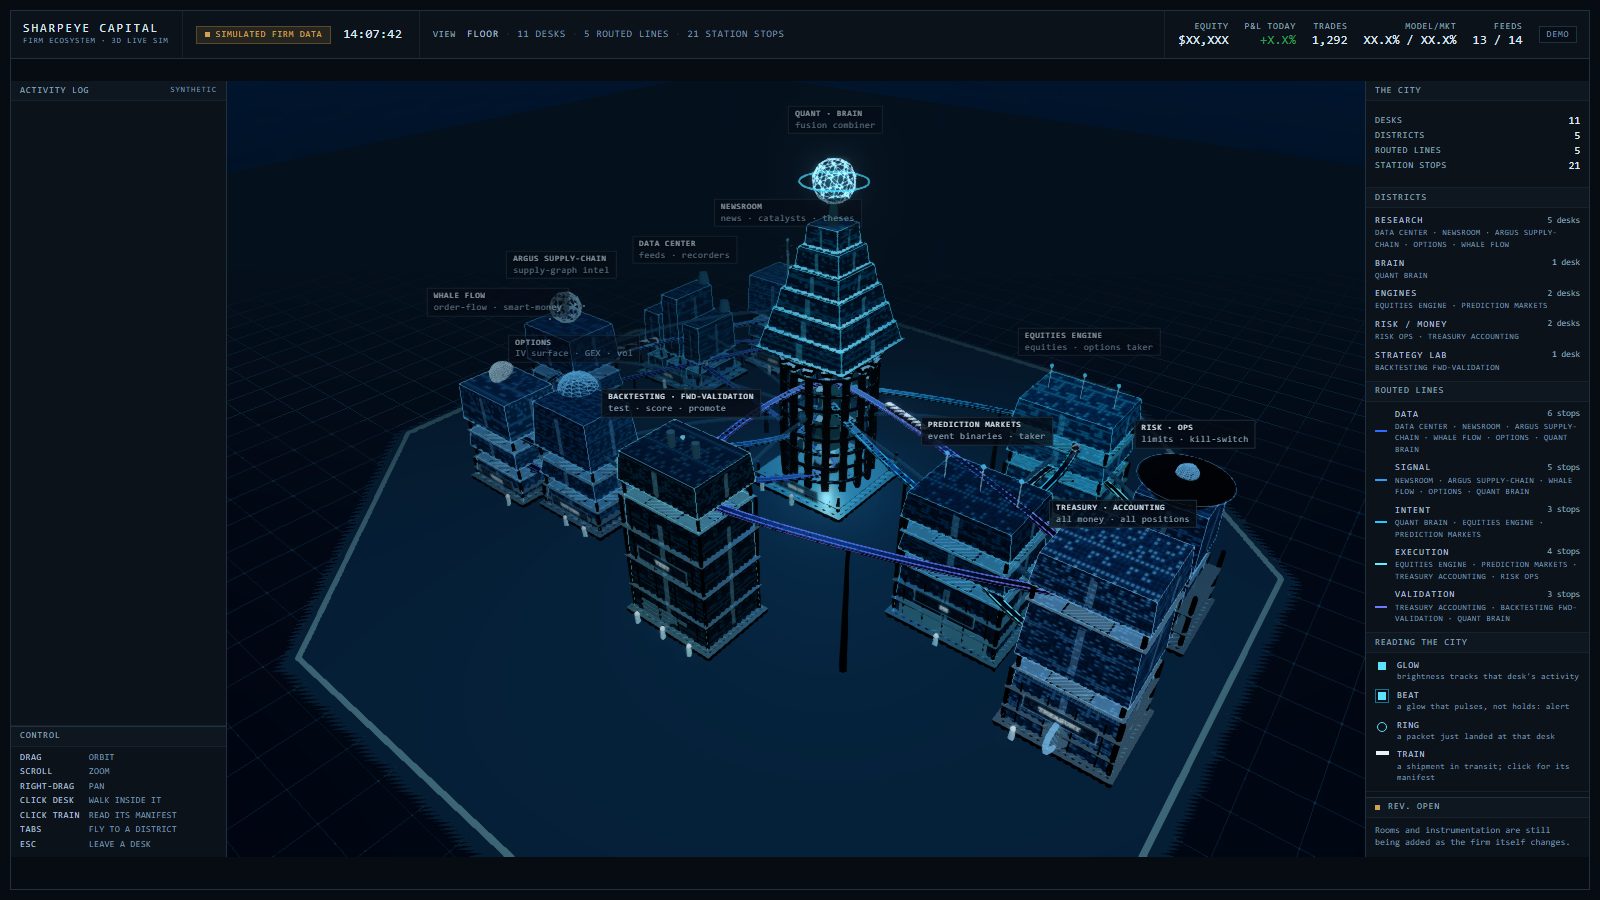
Four sheets, because one drawing could not carry it: what it watches, the seven desks, how a view becomes a position, and how a strategy earns real money.
The terminal this grew out of
These are captures of an earlier dashboard — the one built to track what was failing, which paths were wrong, and what needed rebuilding. Its rooms now live inside the 3D ecosystem above, connected rather than side by side. It is here because the instrumentation is where the current design came from, not because it is what runs today. Redacted where positions or sizing would be readable; cropped, never recoloured.
The other systems
five of them · three you can use
SHEET 01
CASE STUDYARGUS
Who supplies whom in AI infrastructure, with a source for every connection
A map of who supplies whom across the companies building AI infrastructure. Every connection says how confident it is and which document it came from, so a claim can be checked rather than taken on trust. Partners and competitors were not recorded at all before this; now all four kinds are.
- What it maps
- 2,930 connections across 72 companies
- Where they came from
- 2,119 of them name the filing they were read out of
- This is the demo set
- A working slice, not the full graph. The complete version covers far more of the infrastructure; this carries enough to check the method against its sources
SHEET 02
USABLE · LIVE DATASector Board
Which parts of the market are leading, recalculated as you watch
Five years of daily prices for the S&P 500 and the 11 funds that split it into sectors are stored inside the page, then topped up with live prices when it opens. Nothing here is a screenshot: every number is recalculated in your browser, so you can wind the date back and watch the whole board change.
- What it covers
- The S&P 500 and the 11 funds that divide it up — technology, energy, healthcare, utilities and the rest
- How much history
- 1,254 trading days, about five years
- Price used
- Adjusted close — the price with dividends added back in. Using the plain price instead mis-ranks the steady, higher-yielding sectors by a wide margin
- How it is checked
- The same maths is written twice — once in the page, once in Python — and the build stops if the two disagree on any of 240 numbers
SHEET 03
USABLE · LIVE DATABalance Sheet Bot
Company health, with the filing that reported every figure
The tool reads annual reports filed with the SEC and grades a company's balance sheet on 19 ratios in five weighted groups. It runs across the AI-infrastructure sector; the version on this page is a fixed snapshot of 20 of the largest, five years each, so it works without a server and every figure can be checked against the document it came from.
- Scope
- The tool covers the AI-infrastructure sector. This page carries a fixed snapshot of 20 of the largest, so it needs no server
- The model
- 19 ratios in 5 weighted groups — debt and profit 25% each, cash and quality 20%, growth 10% — then a letter and a direction
- Numbers checked
- 3,233 matched to a line the filing actually prints
- Years verified
- 95 of 95 company-years pass every column check
- If a check fails
- the build stops — there are 14 of them, and none is optional
SHEET 04
USABLE · LIVE DATAKRITERION
Whether getting a collectible card professionally graded actually pays
Collectors pay companies to authenticate a card and score its condition, and a high score can multiply what it sells for. This checks 2846 cards and works out, after every single cost, whether sending each one in would actually make money. 950 would. The rest look profitable right up until you count the fees.
- What it checks
- 2846 cards, priced across seven grading companies
- How many pay
- 950 of 2846, once every cost is counted
- What counts as a cost
- Grading, postage both ways, handling, the selling fee and sales tax — and profit is measured against everything spent, not just the card's price
- The surprise
- The cheapest grader is the worst deal. Its scores sell for so much less that the money saved on fees disappears
- What it disproved
- Two fee figures repeated all over the hobby are not in the graders' current terms at all
SHEET 05
CASE STUDYKalBot
How a small advantage disappeared, and why the win rate never showed it
A binary settles at 100¢, so the arithmetic is exact rather than modelled: the book received 970 of 990, which puts breakeven at 97.98¢. So the edge — the margin that made the strategy profitable at all — was 2.02¢ wide. A win rate cannot see a gap that small closing, which is why the strategy looked healthy right up until it was not.
- Recorded
- The endpoints and the whole right column — mechanism, not model
- Modelled
- Three curves from one decay exponent, and the exponent is a slider
- Control
- An ENDPOINTS ONLY button strips every modelled mark
Why the numbers can be trusted
The honesty contract
Every system ships with a dated snapshot to fall back on, and replaces it with live data only on a response that passed every check. The badge always states which of the two you are reading, and how old it is. A panel that quietly falls back while still claiming to be live is worse than one that never tried.
That is a testable property rather than a claim about care, so it gets tested adversarially. The most recent pass asked whether a real ticker could ever carry a price it did not fetch. It found two defects sharing one root cause — a refusal path that restored the display on transport failures but not on malformed responses — and both are fixed and re-verified.
Where a figure cannot be verified, it is labelled rather than dropped. The supply map can put a dollar size on 50 of its 2,930 connections and says so on its face; the firm simulation's own profit and loss is masked demo data under a separate badge, because one claim cannot honestly cover two states.